Confusion Matrix
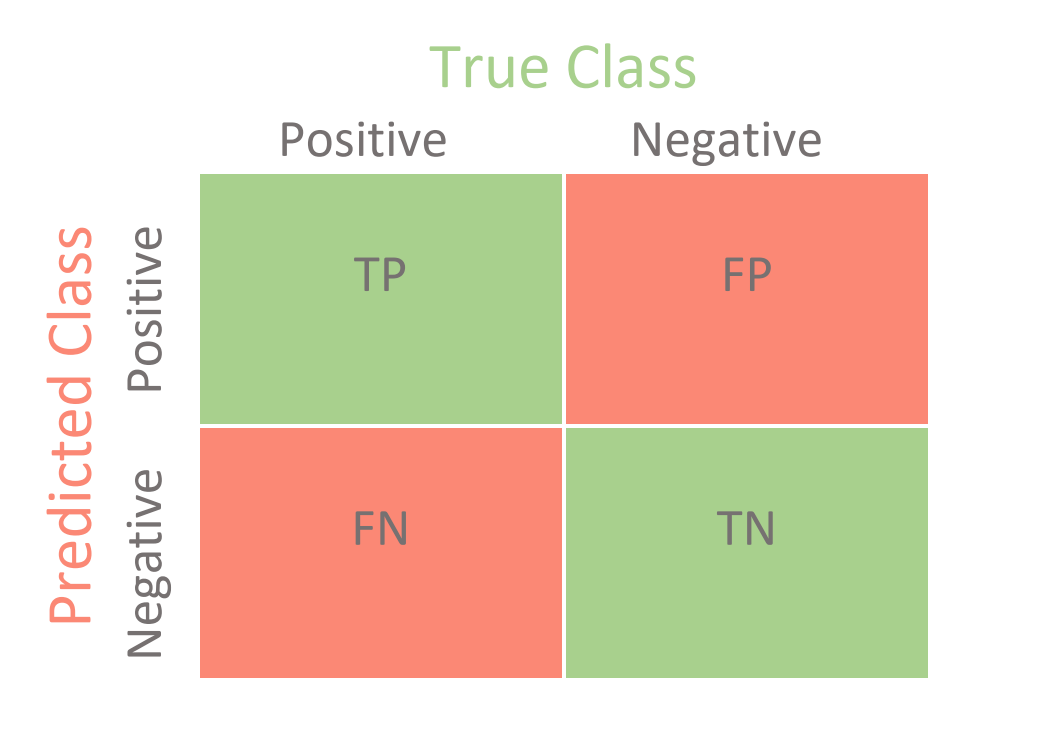
Confusion Matrix
Performance measures
Accuracy
= the fraction of the total samples that were correctly classified by the classifier
Misclassification Rate/Classification Error
= the fraction of predictions were incorrect
Precision
= the fraction of predictions as a positive class were actually positive
Sensitivity / True Positive Rate (TPR) / Probability of Detection / Recall
= the fraction of all positive samples were correctly predicted as positive by the classifier
Specificity / True Negative Rate (TNR)
= the fraction of all negative samples are correctly predicted as negative by the classifier
In clinical studies, accuracy can be seen as a weighted sum of sensitivity and specificity:
accuracy = sensitivity x prevalence + specificity x (1 - prevalence)
where prevalence represents the probability of a disease (positive).
F1-score:
= It combines precision and recall into a single measure. Mathematically it’s the harmonic mean of precision and recall (range in
How to choose between precision and sensitivity
- by assigning a higher weighting to the examples of (the SVM algorithm accepts weightings of classes as input)
- by tuning hyperparameters to maximize precision or recall on the validation set
- by varying the decision threshold for algorithms that return probabilities of classes; for instance, if we use logistic regression or decision tree, to increase precison
Cumulative Accuracy Profile (CAP)
resource: https://waleblaq.medium.com/the-cap-curves-the-cumulative-accuracy-profile-58a141e01fae
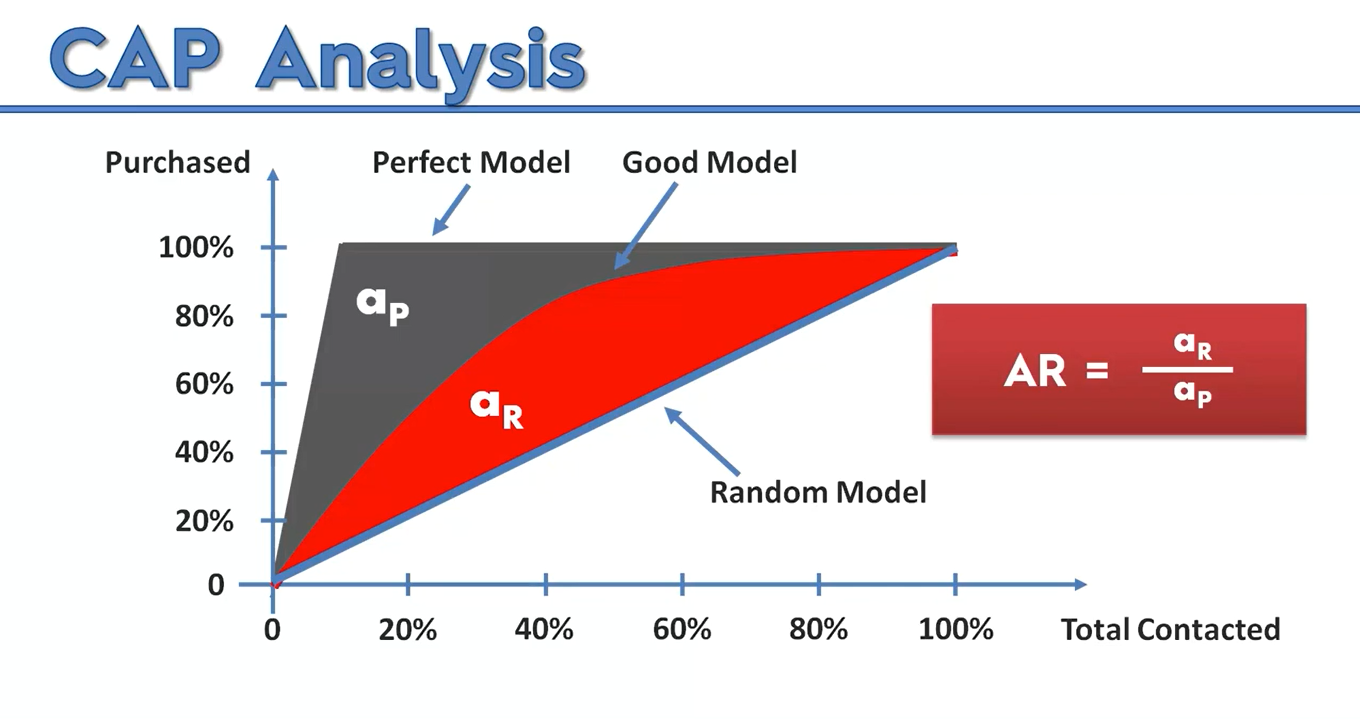
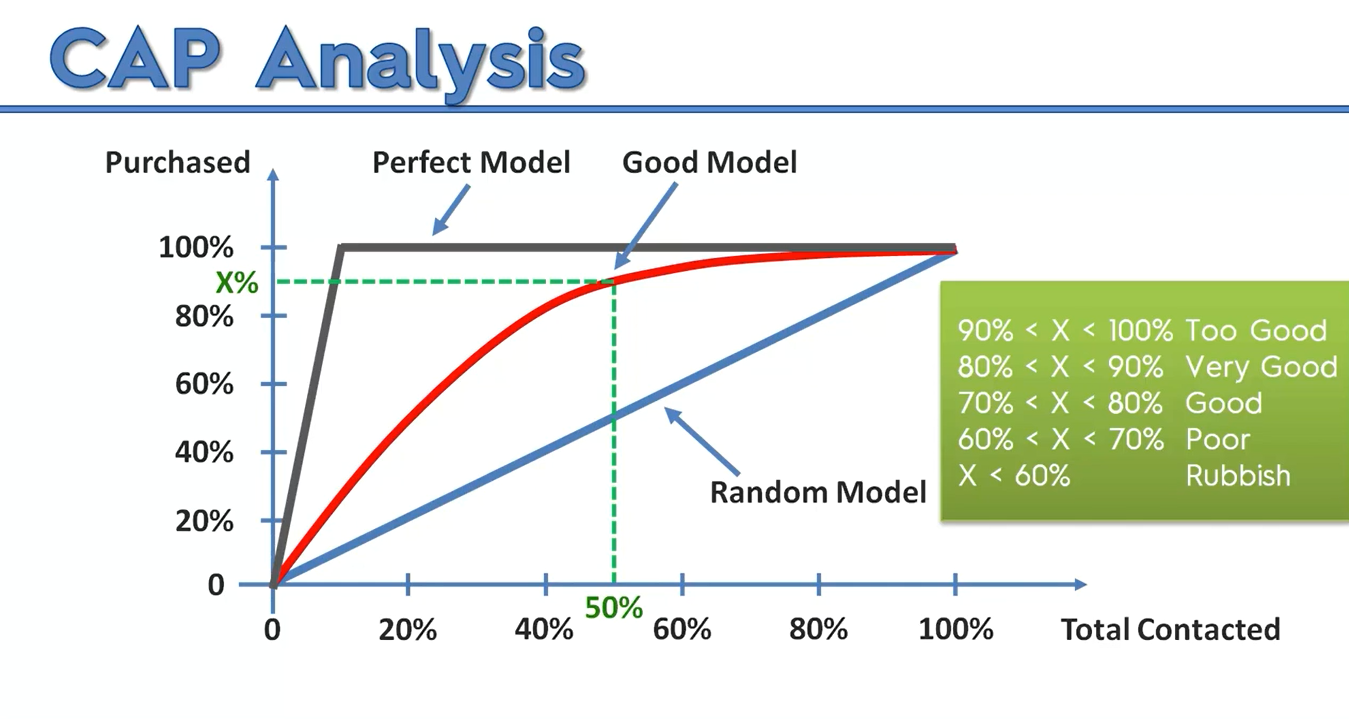
- CAP is used to visualize the discriminative power of a model.
- The CAP of a model represents the cumulative number of positive outcomes along the y-axis versus the corresponding cumulative number of a classifying parameter along the x-axis.
CAP Analysis
We can analyze the cap curve in 2 ways.
Way 1: ratio of the areas under the good model to the area under the ideal curve

Way 2:

Receiver Operating Characteristic (ROC) & AUC
ROC
- ROC != CAP
- ROC plots the true-positive rate (Confusion Matrix#Sensitivity / True Positive Rate (TPR) / Probability of Detection / Recall) against the false-positive rate, where false-positive rate is the proportion of negative examples predicted incorrectly:$$FP/(FP+TN)$$

(ROC) AUC
ROC AUC = ROC Area Under the Curve
- ranging from 0 to 1
- 0.5 for random classifier
Tests for comparing AUC
- Delong's test
- to compare two AUCs derived from the same dataset for a binary classification
- nonparametric approach: it uses a rank-based method to compute variances and covariances of AUC estimates
- The test statistic (
) is given by:
